

Overachieving and underachieving college football programs throughout the FBS
February 4, 2015
Earlier today I published an article today for FiveThirtyEight about the college football programs which over and underachieved given their recruiting success. In the article I only looked at schools in the Power-5 conferences. I had a handful of people on Twitter ask what the results look like when you include all FBS schools. Here’s your answer.
![]()
This first graph shows the relationship between recruiting succes (x-axis) and on-field success (y-axis). As you can see, there’s a clear relationship between the two. The more recruiting points a team earned between 2011 and 2014, the lower their Massey rating (i.e. the better their team).
The lower right quadrant are teams that recruited well and performed well on the field. Included here are semifinals teams Alabama, Ohio State, and Florida State. In the upper left are teams with poor recruiting and poor on-field performance. Most of these schools are not in the power 5.
The lower left are overachieving teams; those with relatively weaker recruiting classes but strong on-field performance. Among these are Georgia Tech, Kansas State, Utah State, and Memphis. The closer a school is to the top right corner, the more of an underachiever they are. The culprits here are Michigan, Texas Tech, and Vanderbilt.
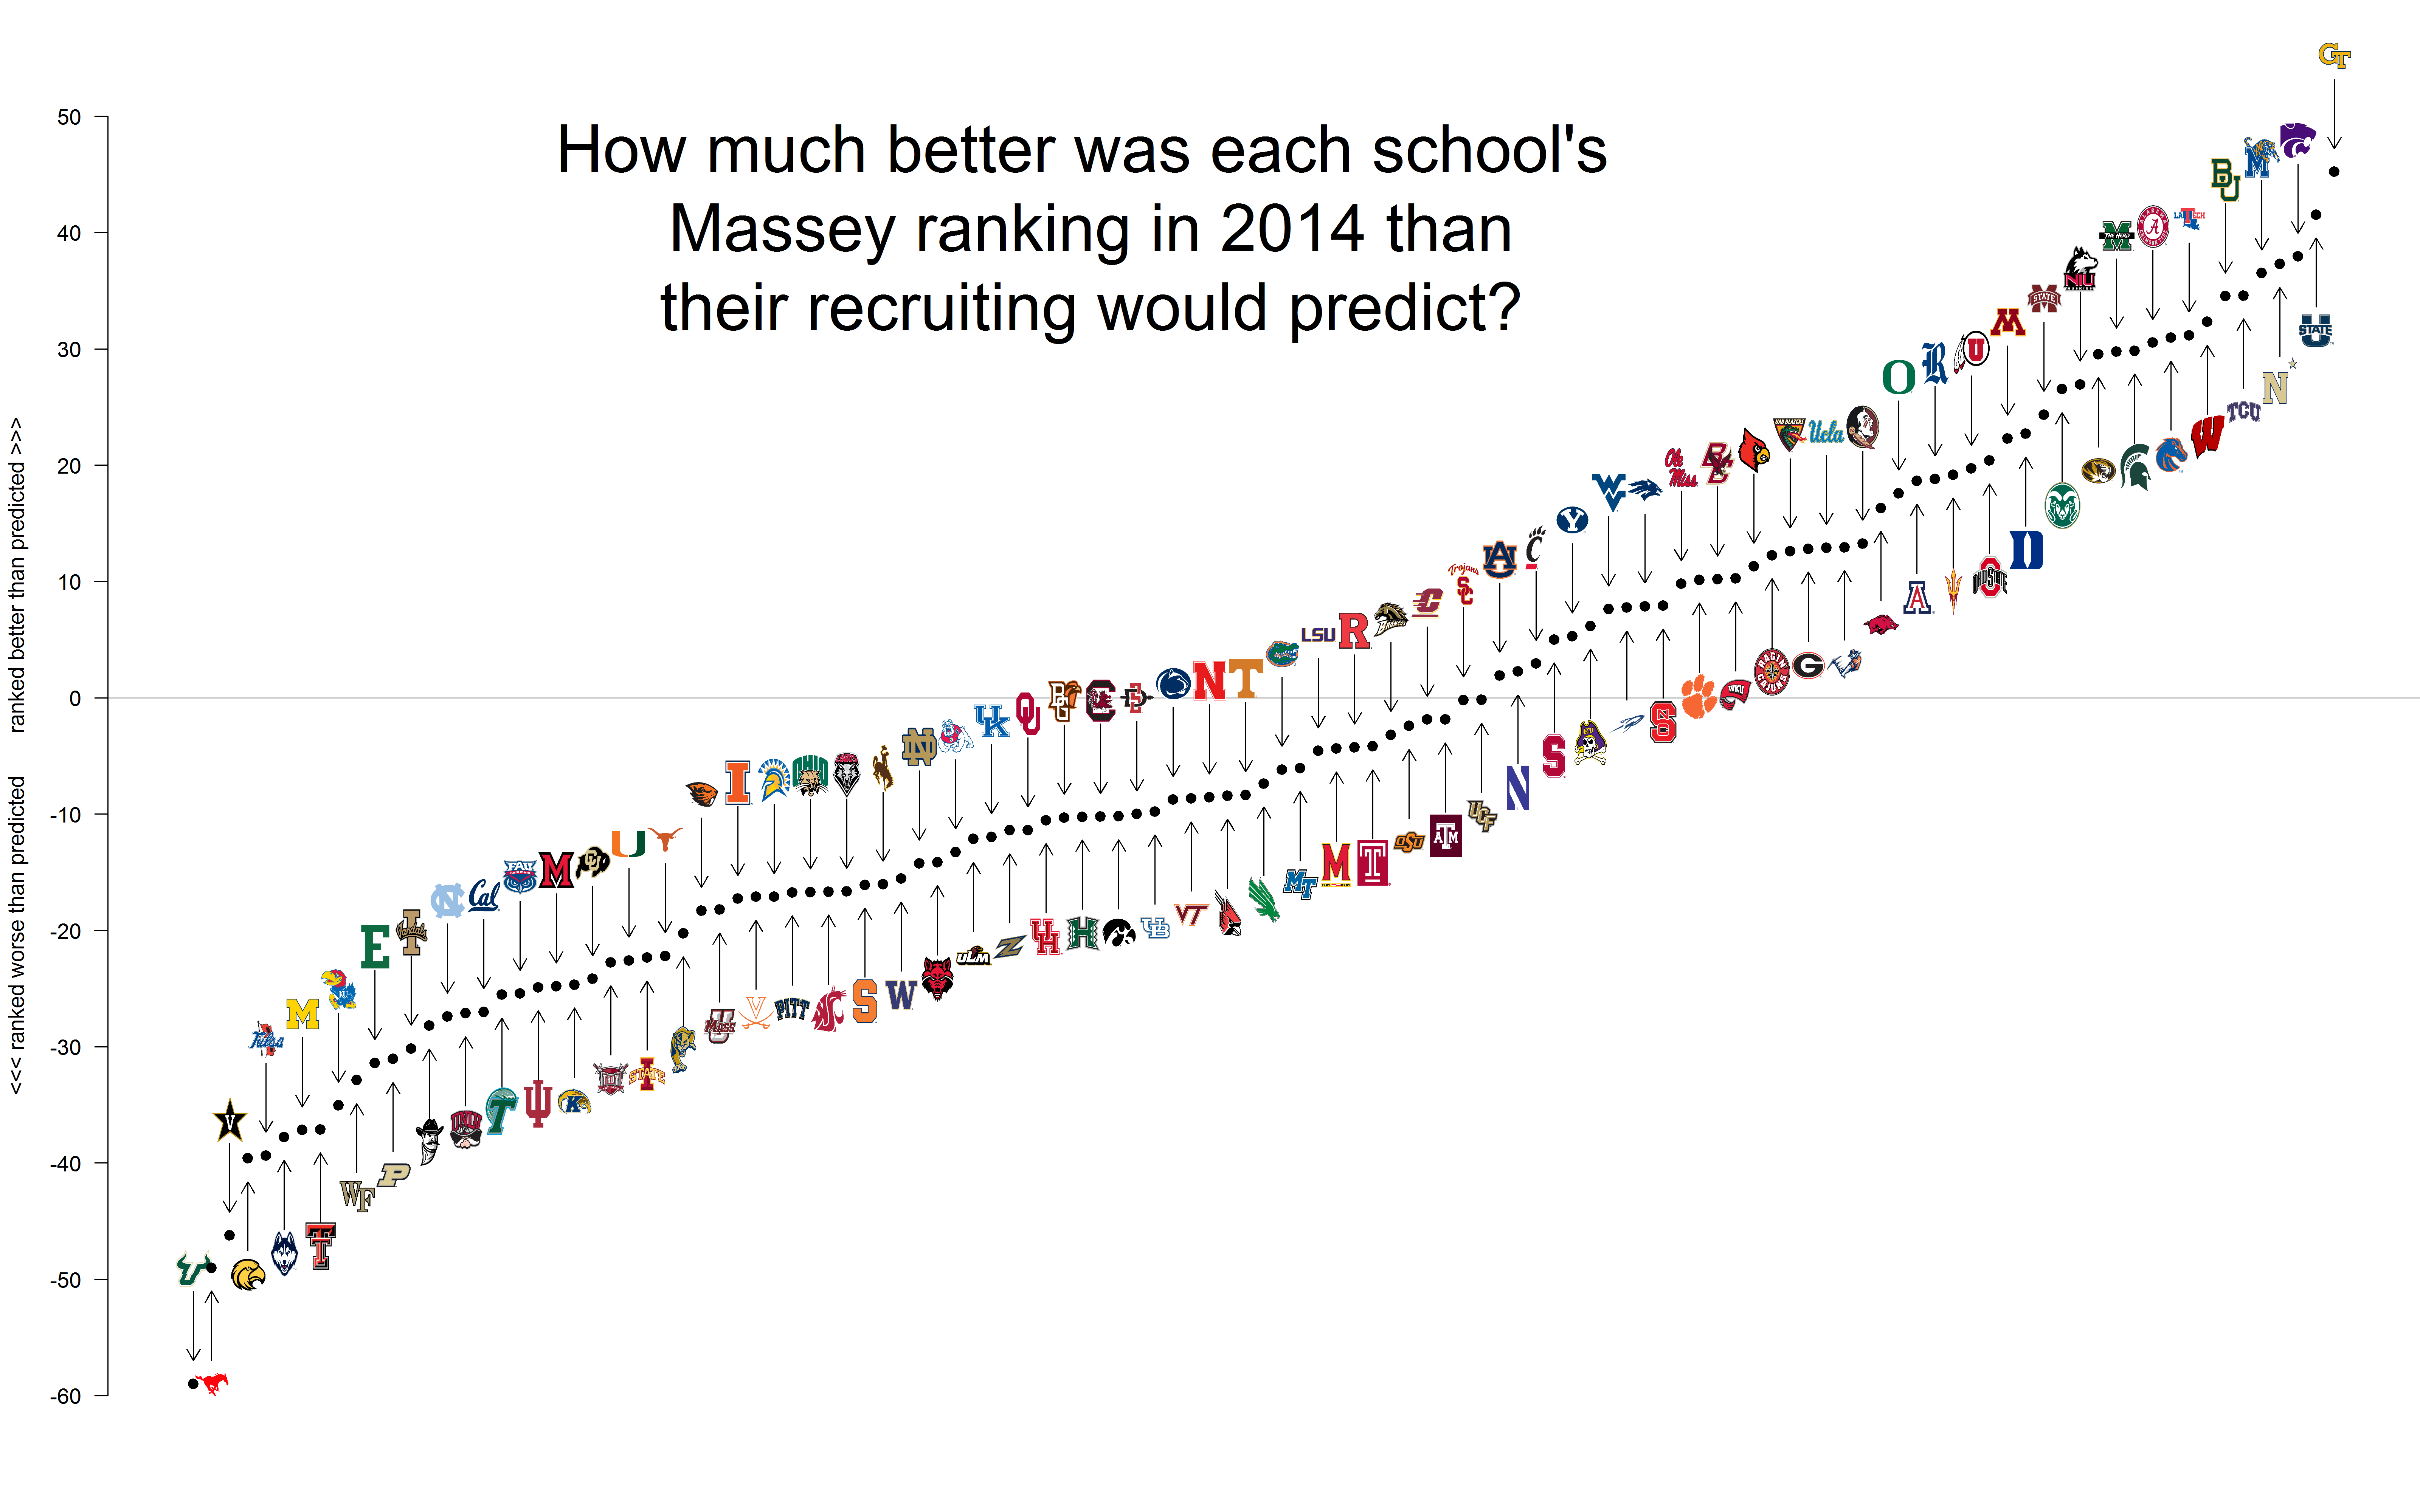
The next graph is similar to the one in the FiveThirtyEight article, except this one includes all the FBS schools. It’s probably easier to see if you click the image to zoom in. Non-Power 5 schools who overachieved in 2014 were Utah State, Memphis, and Navy. Vanderbilt remains toward the bottom of the graph, joined by the underachieving programs at South Florida, SMU, and Southern Mississippi.
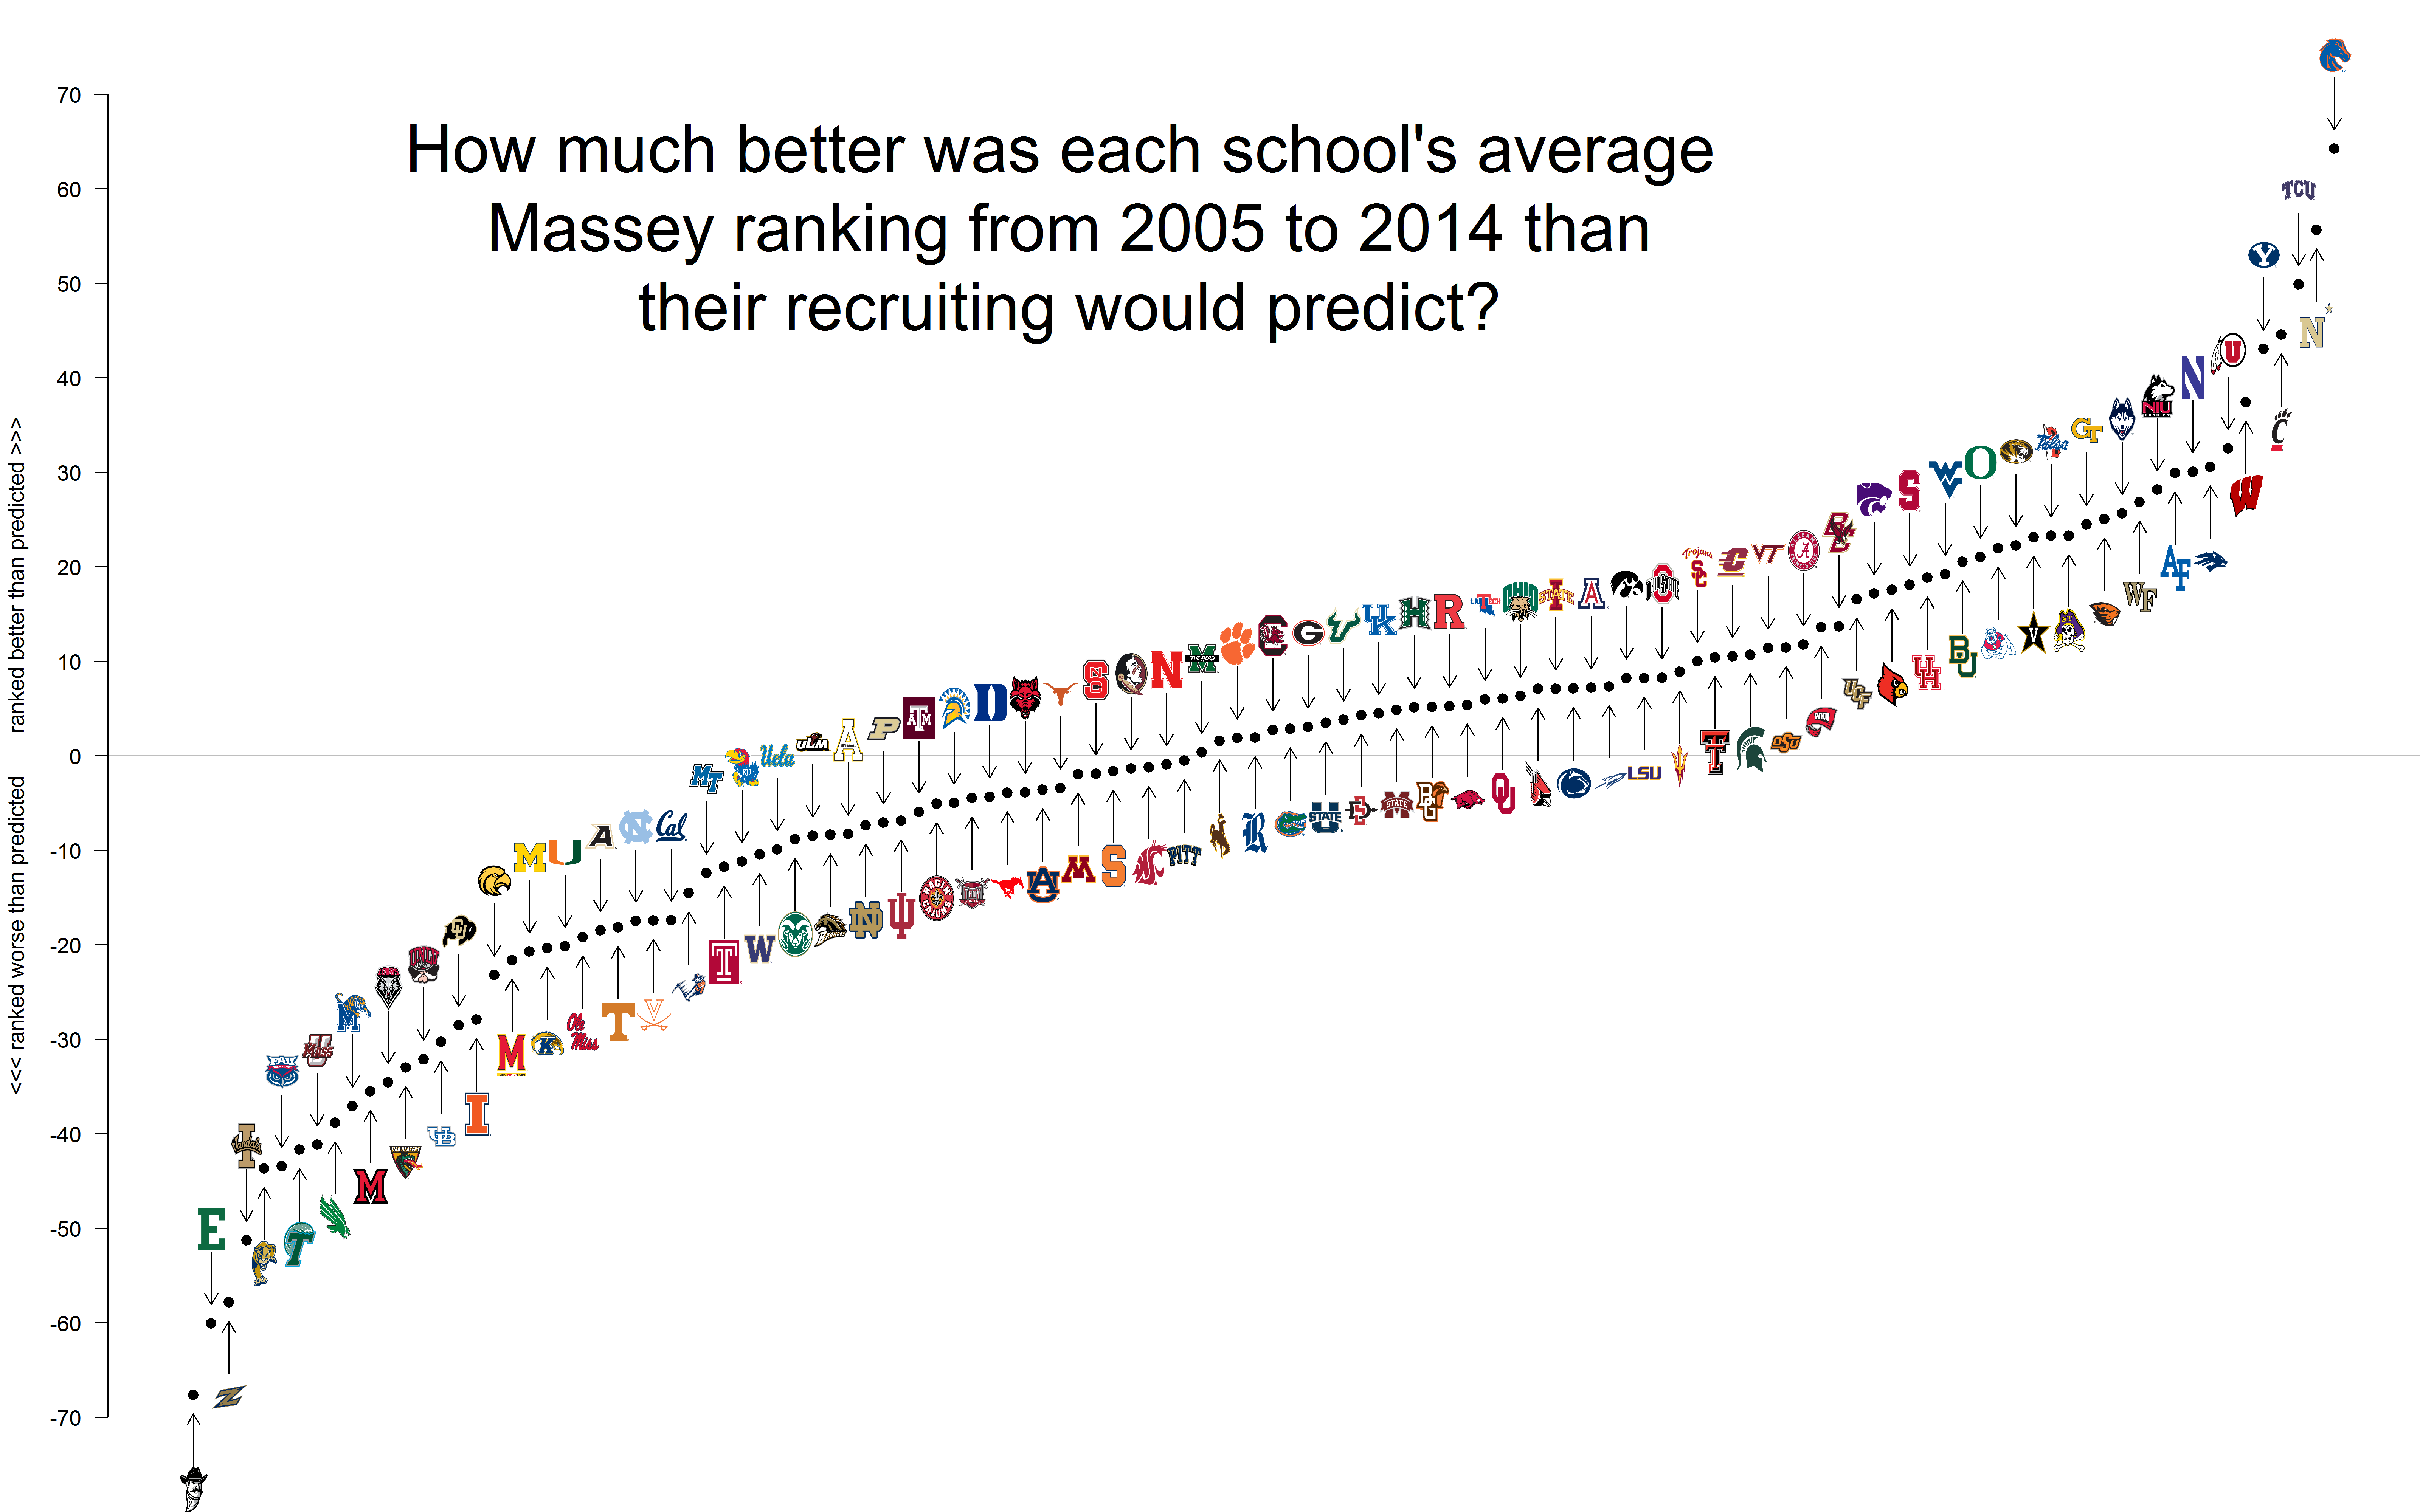
The last graph shows the average over and underachievement of all FBS schools since 2005. When you include TCU’s non-Power5 seasons (which I did not do for the FiveThirtyEight article), they jump ahead of Wisconsin in the overachiever ranking. As you may expect, Boise State dominates the metric, finishing almost 70 spots higher in the Massey ratings than their recruiting would predict.
Toward the bottom of the distribution are mostly non-Power 5 schools. New Mexico State, Akron, Eastern Michigan, and Idaho have been among the least successful teams at turning recruitment into success.
One thing I should note about these results is that they’re similar to those from the original article, but they won’t be exactly the same (even for Power 5 schools). This is because the regression that I used to generate these results came from a dataset with every FBS school, not just the Power-5.
If you’re interested in seeing the actual numeric values that fed into these graphs, you can download the data here. You’ll notice that the 2014 coefficient for three schools is missing. This is because there was some weirdness in the Rivals data, so I wasn’t able to include them in that part of the analysis.